Your portfolio decision
What $200 more a month really costs when markets drop

As I’ve shared before, I believe you can do anything, but you can’t do everything.
So we make trade-offs.
You choose what to do with your time, energy, and money. And you choose what you’re willing to give up in return.
Economists call this opportunity cost.
Today, let’s look at one trade-off: how you invest your money.
Here’s a chart that shows the monthly retirement paycheck for one mix of stocks, bonds, and cash:
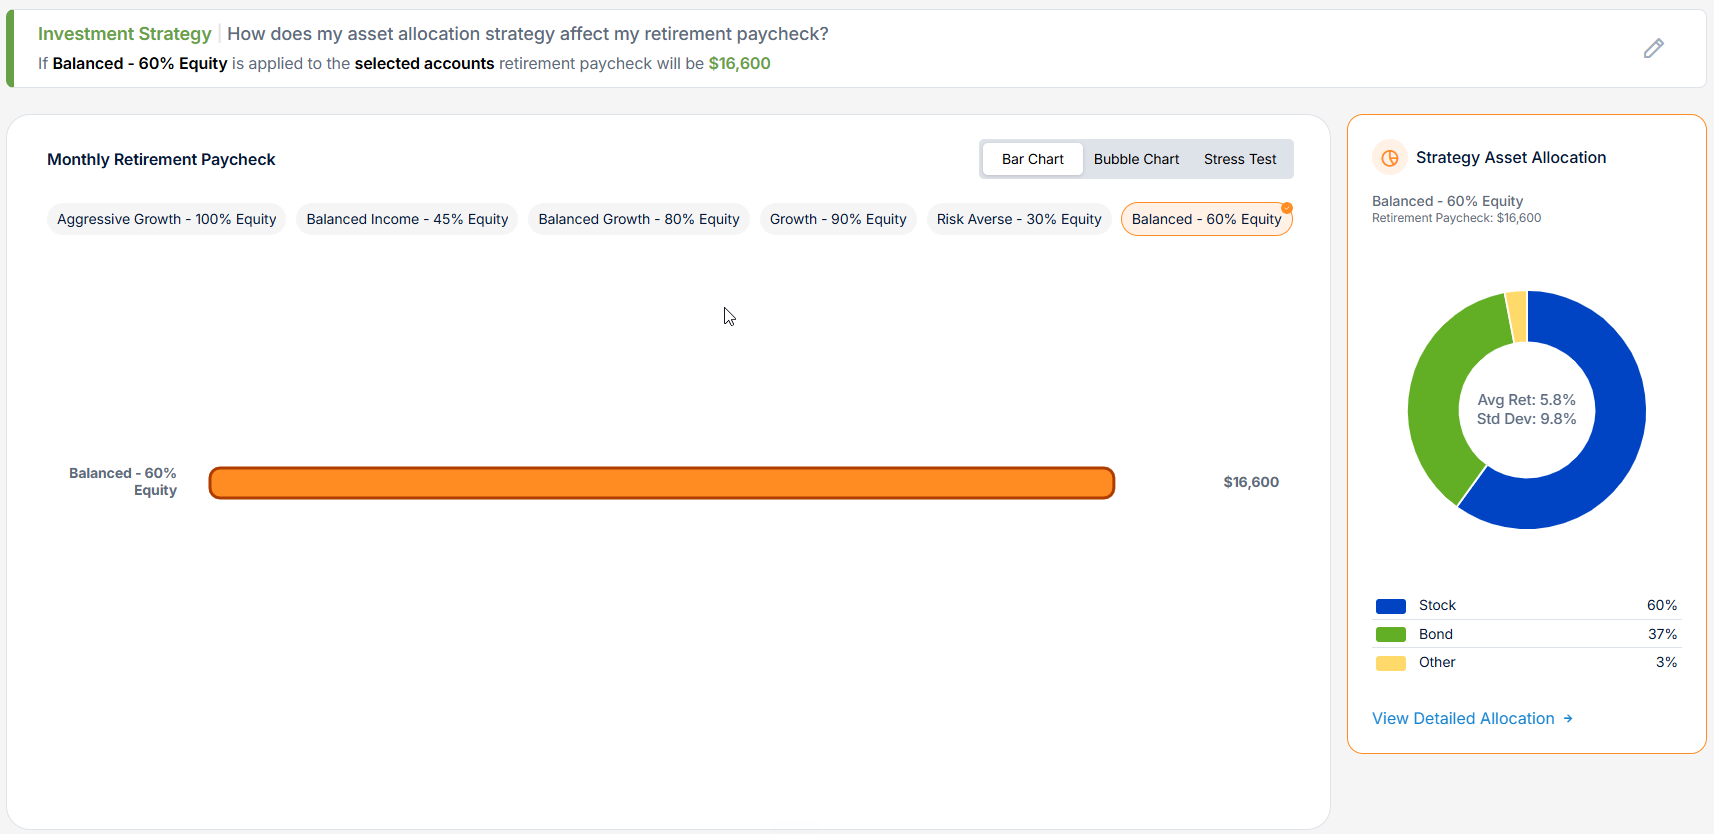
This isn’t a real client, and there’s a lot more to their plan. But today I want to focus on just one choice: their portfolio.
In the chart above, a portfolio with 60% in stocks gives a monthly retirement paycheck of $16,600. This is a “middle of the road” portfolio mix, and many of my clients use something like it.
The chart gets more useful when we add more options:
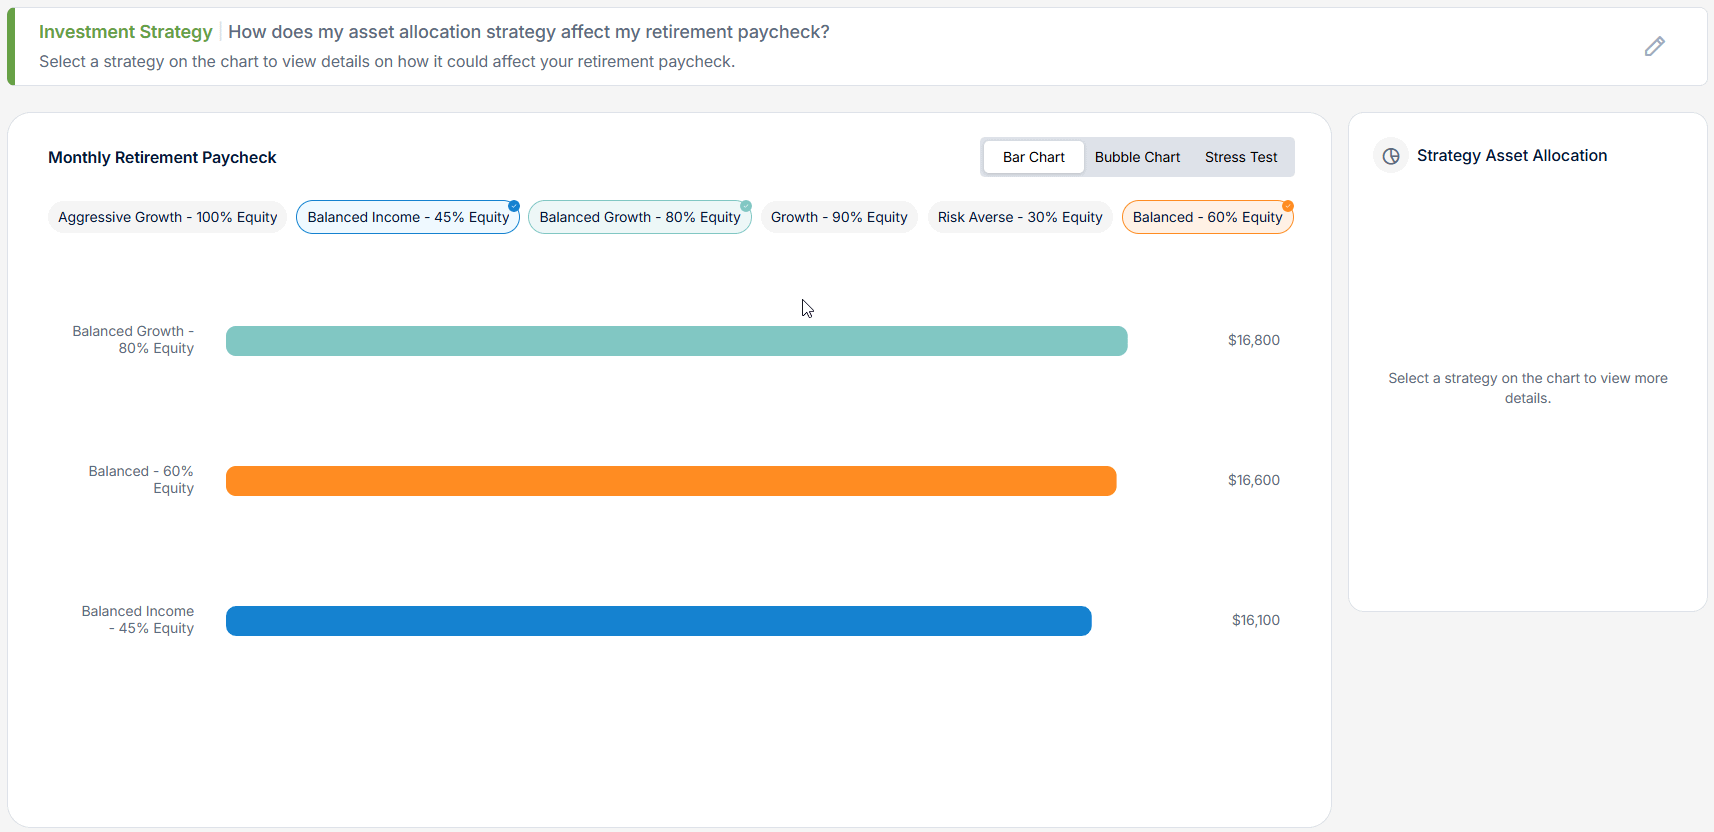
This is the same chart, but now it shows 2 more portfolios.
With 60% in stocks, the paycheck is $16,600.
With 80% in stocks, the paycheck goes up to $16,800.
With 45% in stocks, it drops to $16,100.
So why wouldn’t everyone pick 80% stocks and the bigger paycheck?
Risk.
More stocks means more short-term volatility. It’s a bumpier ride.
Here’s another way to look at the same thing:
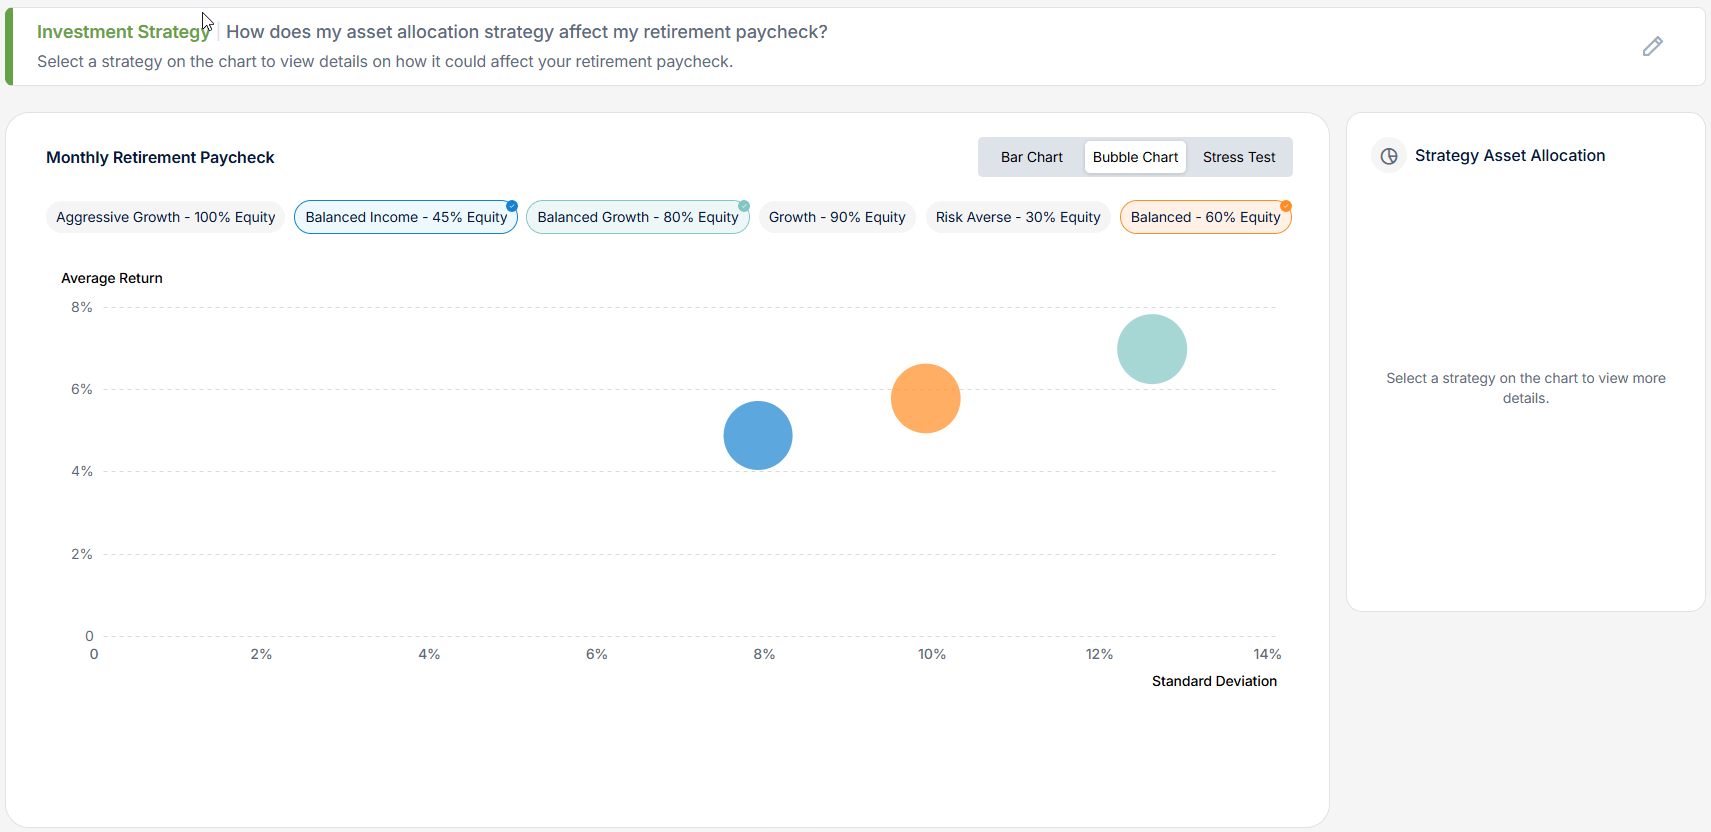
In this chart, the higher a portfolio sits, the more it might earn. The farther right it sits, the more risk and volatility.
We measure risk and volatility with a statistic called “standard deviation.”
It’s a calculation of how far your returns might swing above or below an average. It’s useful, but it isn’t always how risk really feels when it comes to your money.
Here’s another chart that shows the trade-off in a different way:
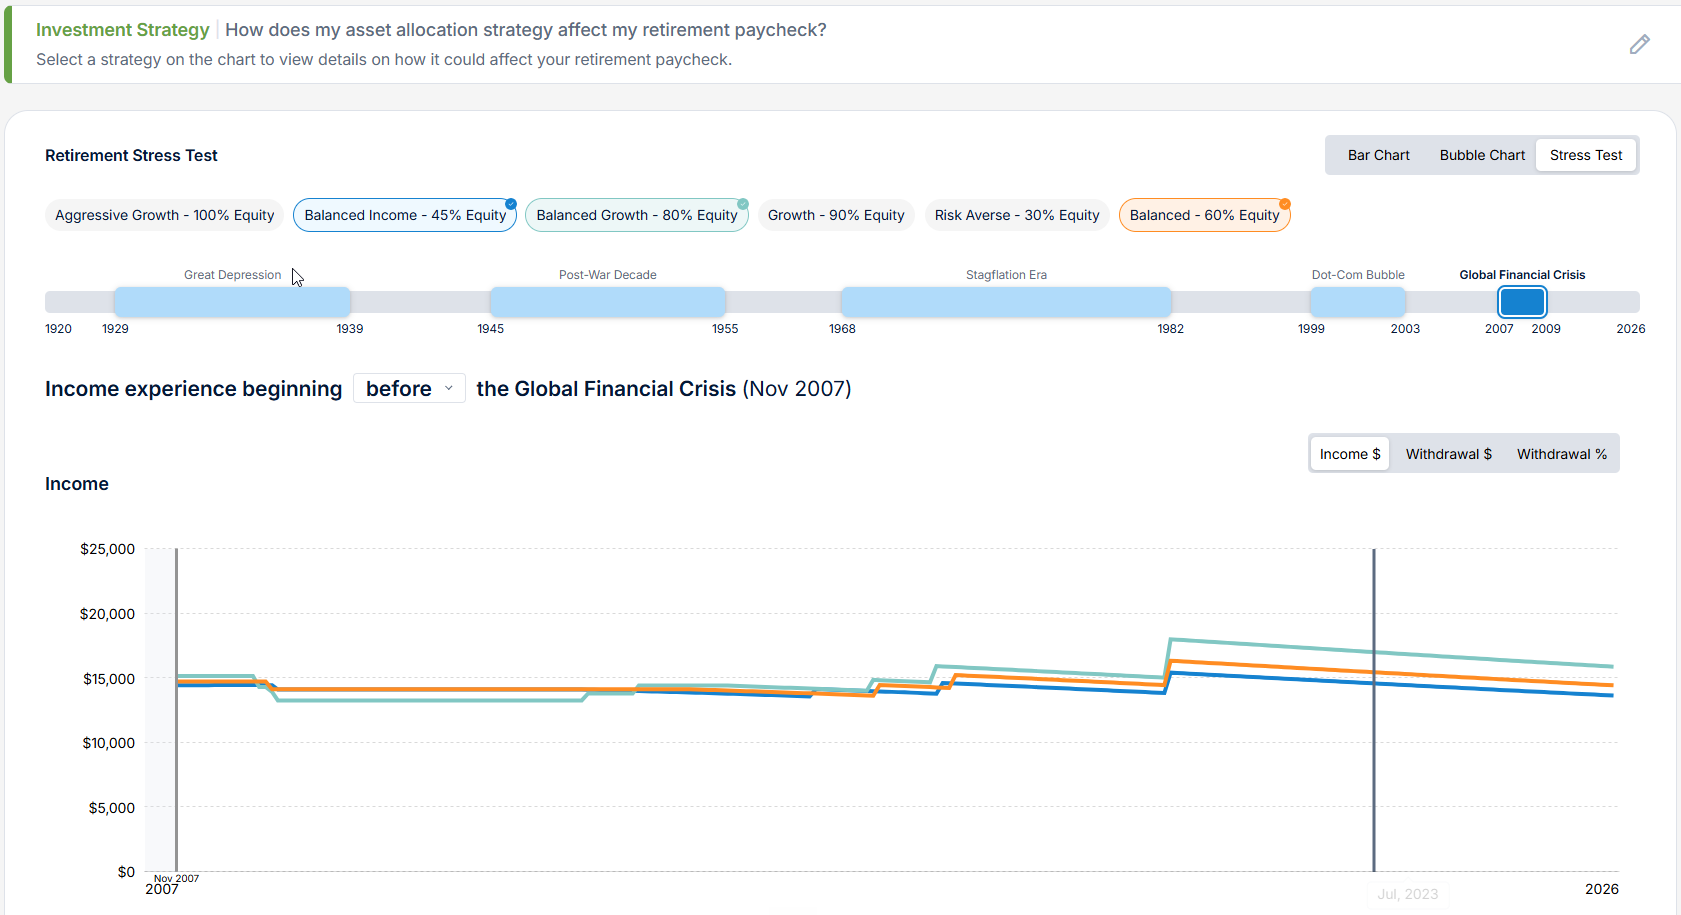
Let’s jump in a time machine. Say this client retired in November 2007, just before the 2008 market crash.
In the first few years, the retirement paycheck gets reduced. The 80% stock portfolio (green line) takes the biggest pay cut.
But with time and patience, the pay raises come. In the end, the paycheck is higher than where it started.
So your portfolio’s value will go up and down. And when it does, your paycheck can go up and down too.
As will your lifestyle.
Now here’s the same chart, but showing how much the portfolio was worth instead of the retirement paycheck:
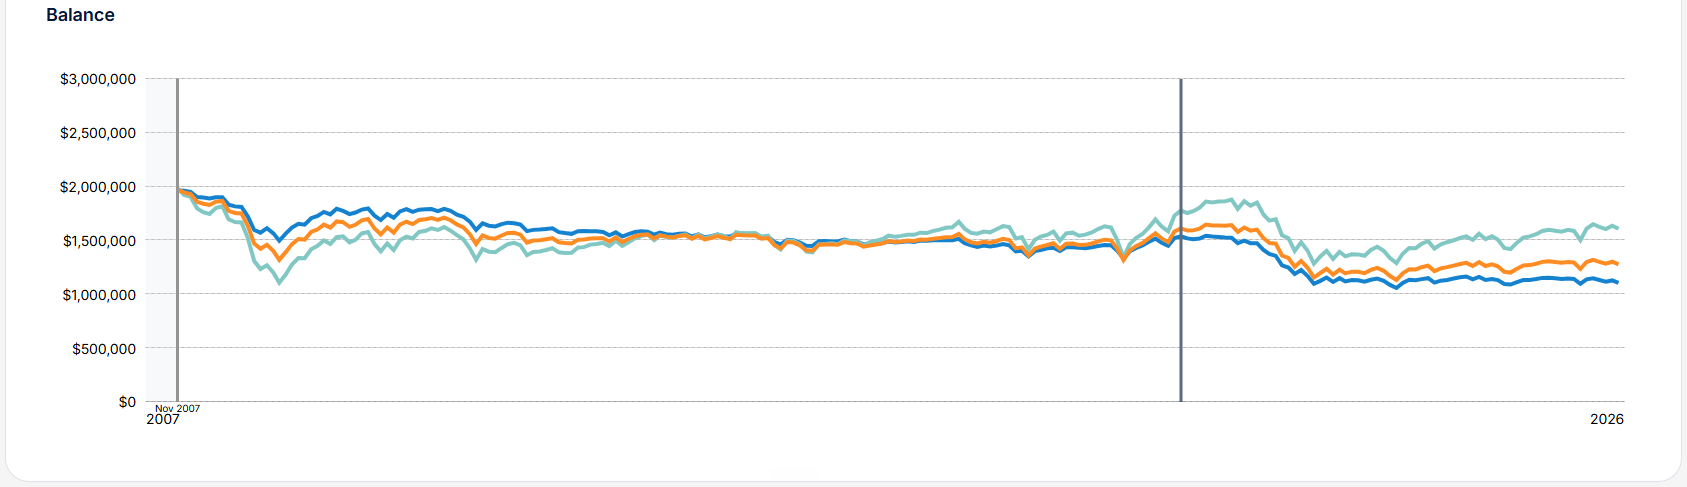
The portfolio starts at $2 million in November 2007. By February 2009, the 80% stock portfolio (green line) falls to $1.1 million.
That’s a big drop.
Would you be okay with that in return for about $200 more a month?
If you were willing to stick with the plan, though, the story has a happy ending.
By mid-2021, the 80% stock portfolio was worth over $200,000 more than the other portfolios. And it helped fund your retirement paycheck each month along the way.
My team and I manage 6 different portfolios for my clients.
I believe the best portfolio for you is the one you can stick with for decades. No matter what the markets do. No matter what life throws at you.
That’s your real portfolio decision.
Your portfolio needs to pay for your retirement paycheck and your lifestyle. But once it does that, why take on more risk than you need?
Trade-offs don’t stop with your portfolio. And they aren’t only about money.
Over the next couple of weeks, I’ll share more retirement planning trade-offs.
For now, hit reply and tell me what you think. I’d love to hear your questions about money choices and the trade-offs that come with them.
Until next Wednesday,
Russ
P.S. Based on what I’ve shared above, do you think your “portfolio decision” about risk? Is it about return? Is it about your retirement paycheck? I believe it’s about all of these along with how much (or little) you’ve saved as well as the element of time. And the tradeoffs among them all. Stay tuned for more…
IMPORTANT: The projections or other information generated by Income Lab regarding the likelihood of various investment outcomes are hypothetical in nature, do not reflect actual investment results and are not guarantees of future results. The results generated may vary with each use and over time.
Discussion about this post