

What’s inside your portfolio
A simple breakdown of how a diversified portfolio actually works

In a recent client feedback survey, someone asked a great question.
They wanted a better explanation of why their portfolio balance changes look so different from what they see in the news.
It’s one of the best questions I’ve gotten in a while. And I’d bet many of you have wondered the same thing.
So let’s take a look.
A tale of different numbers
In 2025, the diversified 60% stock & 40% bond portfolio model my team and I manage for clients returned 14.42%. That’s a gross return, before my fees.
That’s a solid year by almost any measure.
For reference, here are how some of the stock market indices fared in 2025:
S&P 500: +17.88%
Dow Jones Industrial Average: +14.92%
NASDAQ Composite: +20.36%
Naturally, you might wonder, “Why didn’t my portfolio do that?”
Here’s the short answer: your portfolio isn’t trying to be the S&P 500.
It’s built to do something more important.
What “the market” actually means
When most people say “the market,” they’re usually talking about the Dow Jones Industrial Average or the S&P 500.
The Dow? That’s just 30 large U.S. companies. Thirty.
The S&P 500 is broader — 500 large U.S. companies — but it still only represents one slice of the investment world. It doesn’t include smaller U.S. companies. It doesn’t include international companies. It doesn’t include bonds. It doesn’t include cash.
Your portfolio includes all of those things.
So comparing your returns to the S&P 500 is literally comparing apples and oranges.
Let’s break it down…
Layer one: stocks and bonds
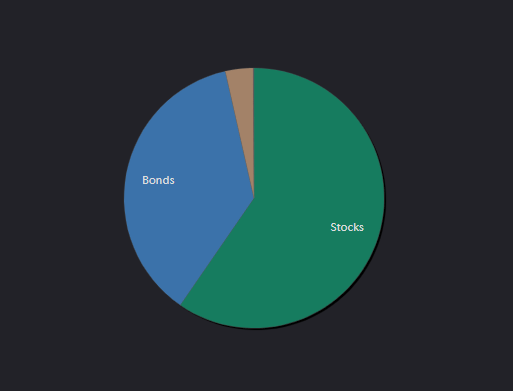
Think of your portfolio as having two main sections.
In this example, 60% is invested in stocks. This is the long-term growth engine — the part designed to build wealth over time.
The other 40% is split between bonds and cash. This is the shock absorber — the part that smooths the ride and provides a cushion when stocks inevitably get bumpy.
In 2025, stocks had a strong year.
Bonds and cash did their job too, returning 7.93% and 4.05% respectively.
Bonds and cash likely won’t keep up with stocks in a good year, and they’re not supposed to.
Their job is to be there when you need them most — during the years when stocks struggle.
Layer two: inside the stock portion
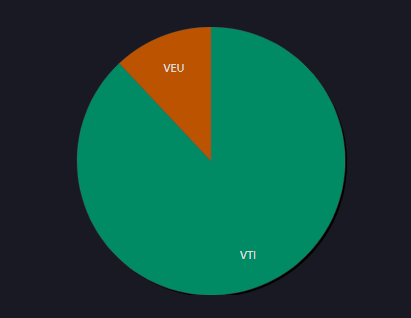
Now let’s go one level deeper into that 60% stock allocation.
About 88% of the stock portion — or 53% of the total portfolio — is invested in U.S. stocks through the Vanguard Total Stock Market Index Fund ETF (Symbol: VTI).
As of December 31, 2025, this fund holds 3,512 U.S. companies of all sizes, not just the 30 in the Dow. Or the 500 in the S&P 500.
The remaining 12% of the stock allocation — about 7% of the total portfolio — is invested in international stocks through the Vanguard FTSE All World ex US ETF (Symbol: VEU).
As of December 31, 2025, this fund gives you exposure to 3,872 companies across Europe, Asia, and other developed and emerging markets around the world.
Here’s where it gets interesting.
In 2025, international stocks (VEU) returned 25.54%.
U.S. stocks (VTI) returned 13.59%.
That might surprise you.
Most years over the past decade, U.S. stocks have been the leader.
But not every year.
And that’s exactly the point.
Diversification means owning different things that behave differently at different times.
Some years, one piece of the portfolio carries more weight.
Other years, a different piece steps up.
You don’t know in advance which one it will be.
Layer three: inside the bond and cash portion
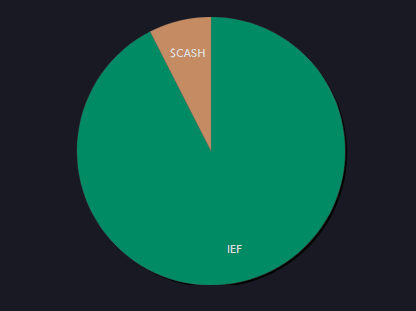
The 40% that isn’t in stocks breaks down into two pieces.
Bonds make up 37% of the total portfolio, invested through the iShares 7-10 Year Treasury Bond ETF (Symbol: IEF) that currently holds 20 different 7-to-10-year U.S. Treasury bonds.
“7-to-10-year” means each of the bonds in the fund matures 7 to 10 years from now.
This fund returned 7.93% in 2025.
Cash makes up the remaining 3%, held in a money market fund.
That returned approximately 4.05%.
Neither of these will make headlines.
But they serve a critical purpose — they’re the steadier part of the portfolio that helps fund your retirement paycheck when stocks have an inevitable rough patch.
For the non-stock portion of this portfolio, bonds are 92.5% and cash is 7.5%.
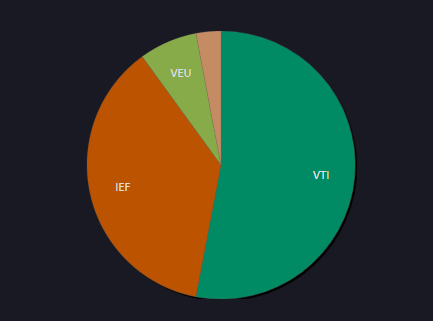
How it all fits together
When you combine all of these pieces — U.S. stocks, international stocks, bonds, and cash — each contributing at different levels, you got an overall portfolio return of 14.42% in 2025.
Not 17.88% like the S&P 500.
Not the 14.92% that the Dow Jones Industrial Average returned.
14.42% — which reflects a portfolio that was designed with a purpose.
Your purpose.
The benchmark that actually matter
Here’s what I want you to take away from all of this.
The S&P 500 is not your benchmark.
The Dow is not your measuring stick.
Nor is the number you hear on the evening news.
Your benchmark is your life.
Can you maintain your retirement paycheck?
Can you continue to live the life you want to live?
Are you on track with your personal financial plan?
Those are the questions that matter.
And the answer comes from a portfolio that’s built for consistency over decades — not one that chases whatever index did best last year.
Or last month.
As I’ve written before, over 90% of investment returns are determined by how you allocate your investments across broad asset classes — not by picking individual stocks or trying to time the market.
Your asset class mix is what matters.
A broadly diversified portfolio with low costs and low taxes might not match the S&P 500 in a given year.
But it’s a portfolio you can stick with through all types of markets.
And the best portfolio is always the one you can stick with.
No matter what.
A note on what this means for you
While I used the 60/40 portfolio model as an example here, many of my clients have a different mix based on their personal financial plan. Your allocation might be 80/20 or 45/55 or something else.
The specific percentages matter less than the principle: every piece of your portfolio has a job, and understanding what you own and why you own it is one of the most valuable things you can do for your financial confidence.
Think of it like your ongoing financial health.
Just as you wouldn’t judge your overall health by one number from one checkup, you shouldn’t judge your portfolio by one index on one day.
Regular check-ins — looking at the whole picture, not just the headlines — are what keep your portfolio and your life on track.
What to do next
The single best step you can take is to have a conversation with your advisor about your portfolio.
Ask two simple questions:
What do I own?
Why do I own it?
If you have an advisor, ask them to walk you through the components of your portfolio and how each piece connects to your financial plan.
If you don’t have an advisor, many online resources — including free tools from Vanguard, Fidelity, Morningstar, and others — can help you better understand what’s in your portfolio and how it’s allocated.
Understanding the “what” and the “why” behind your investments is one of the most empowering things you can do for yourself.
Bottom line
Your portfolio is designed to look different from the headlines.
That’s not a flaw — it’s your plan.
And your plan is built around your life, not the S&P 500.
If you have any specific questions about your current portfolio, please feel welcome to reach out to start a conversation.
This is general education, not personal advice. Returns shown are gross of advisory fees. Past performance does not guarantee future results. Talk with your advisor before acting on anything here.
Links & things
Here’s a worthwhile article for today’s always-connected world:
And here’s a look at how our spending changes as we get older:
Thank you for reading!
If you’re not a client and would like my advice, simply reply to this email with your questions and I’ll be happy to respond with my thoughts…
Until next Wednesday,
Russ